Goals and Plans of Alaska's Railbelt Electric Utilities
Last modified: 26th April 2023
contact: mckittre@gmail.com
In 2023, a mandatory Renewable Portfolio Standard has been proposed for the Railbelt. Each utility has also set a voluntary goal for either renewable energy, emissions reduction, or both. Additionally, each utility projects future electric loads and natural gas needs in RCA filings. This paper compares the impact of these scenarios on renewable energy, gas use, and emissions.
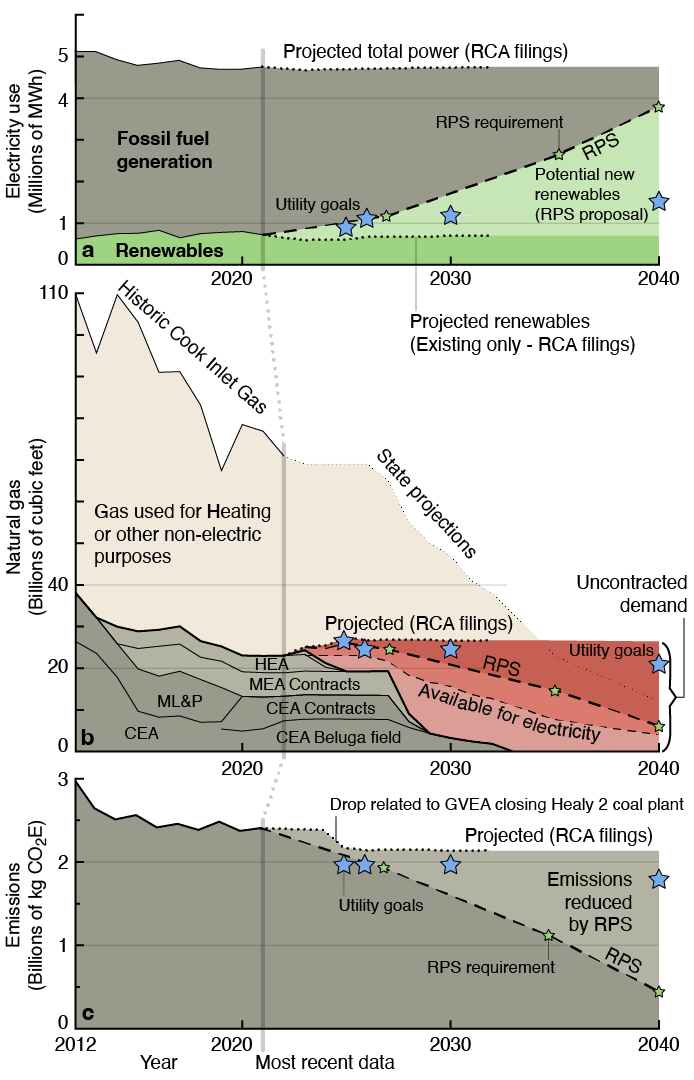
Renewable energy provides around 15% of the Railbelt’s electricity today. If utilities meet their board-approved goals, this will increase to around 25% between 2025 and 2030. This aligns with the first target in the proposed Renewable Portfolio Standard (RPS), which calls for 25% renewable power by 2027.
Beyond this, the RPS calls for a large increase in renewable energy (55% by 2035 and 80% by 2040). Only one utility has set a post-2030 goal, which is substantially smaller.
Utilities’ projections of future gas needs (filed with the RCA annually) do not anticipate meeting either RPS targets or their own internal goals, with renewable energy production for the next decade remaining relatively flat. Projected gas use is higher than current use, due to GVEA’s plan to close a coal plant and buy more gas power. This projected use exceeds current contracts in 2024, with a much larger gap beginning in 2028.
Gas use exceeds projected Cook Inlet gas availability in all scenarios. The state’s 2022 Cook Inlet gas forecast predicts a steep drop in available gas starting around 2027. The ‘Available for Electricity’ line represents 33% of that gas – the same portion electric utilities use today. Heat uses 43%, while oil and gas operations and industry consume the rest. The 2035 and 2040 RPS targets would lead to a substantial reduction in gas use, but still higher than predicted availability.
Coal power has very high greenhouse gas emissions, and GVEA’s plan to close the Healy 2 plant will reduce emissions regardless of what replaces that power. As with the other metrics, if utilities achieve their internal goals, the impact will be similar to the first RPS target. Later RPS targets reduce emissions much more than any utility goals or projections.
Recent Progress
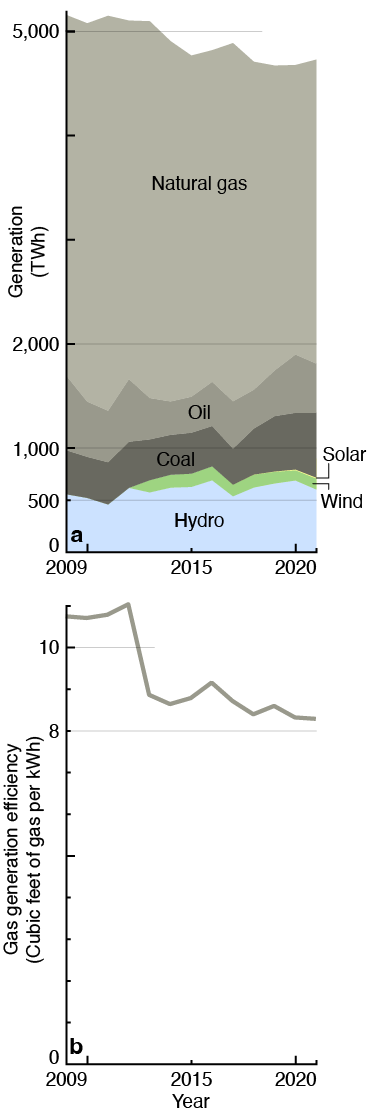
There has been little change in renewable generation since the Eva Creek and Fire Island wind farms came online in 2013. Since then, the Railbelt grid has seen a small decrease in overall power consumption, and some displacement of gas power by coal and oil-fired power.
Between 2012 and 2015, there was a Railbelt-wide replacement and upgrade of older natural gas plants, resulting in a substantial increase in efficiency.
The most significant renewable project in the last decade is the addition of water to Bradley Lake through the Battle Creek Diversion in 2020. This accounted for around 46,000MWh in 2022. It’s not visible in the graph because Bradley generation is highly variable with weather and snowpack.
The rest of the recent renewable growth has been in solar. In the last several years, two small solar projects have come online (GVEA’s 563KW solar farm, and the 1.2MW Willow solar farm), and distributed solar has increased substantially to 13MW in 2022. This is also not visible in the graph because the total is still quite small – about 14,000MWh per year or 0.3% of Railbelt energy. MEA has signed a contract with an independent power producer for a 6MW solar farm, which will add around 9,500MWh of new solar in the next few years.
Individual Utility Goals
Each utility board has passed a voluntary renewable energy and/or carbon reduction goal.
| Utility | Base year | End year | Measurement | Goal | Progress (2021) |
|---|---|---|---|---|---|
| CEA | N/A | 2025 | Renewable MWh | 100,000MWh new | N/A |
| CEA | 2012 | 2030 | Carbon intensity reduction | 35% | 30% |
| CEA | 2012 | 2040 | Carbon intensity reduction | 50% | 30% |
| GVEA | N/A | 2025 | Healy 2 coal plant closure | 40MW wind, 40MW gas | N/A |
| GVEA | 2012 | 2030 | Carbon emissions reduction | 26% | 0.6% |
| HEA | N/A | 2026 | % Renewable | 50% | 15% |
| MEA | 2012 | 2030 | Carbon intensity reduction | 28% | 27% |
Table 1. Current goals and plans of Railbelt utilities as passed by electric utility boards. CEA has both a renewable energy production goal and a carbon intensity reduction goal. GVEA has an emissions reduction goal and a strategic plan to close the Healy 2 coal plant. HEA’s goal is set for Dec 31 2025, so is listed in 2026. Progress for CEA and MEA comes from their own calculations, and for HEA and GVEA from analysis of their RCA and EPA filings.
The following charts express the potential future scenarios (RCA filings, utility goals, and RPS) in terms of the metric each utility has chosen for their individual goal – emissions intensity, total emissions, or renewable energy percentage.
Chugach Electric Association (CEA)
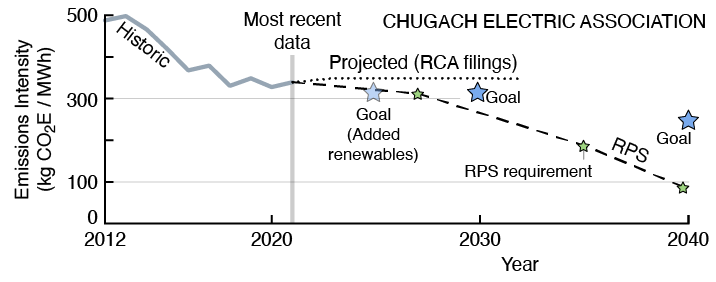
CEA goals call for a 35% emission reduction by 2030, and a 50% reduction by 2040, using a 2012 base year. 30% of this reduction has been achieved, largely due to the gas plant upgrades between 2012 and 2014. CEA also has a separate goal of 100,000MWh of new renewable power by 2025. This amount of renewable energy will lead to approximately the same emissions reductions as the 2030 goal. This goal also meets the 2027 RPS target of 25% renewable energy. The 2040 RPS target leads to much greater emissions reductions than CEA’s 2040 goal. CEA’s RCA filings of gas need projections do not predict any new renewable energy, and do not align with the utility’s goals.
Golden Valley Electric Association (GVEA)
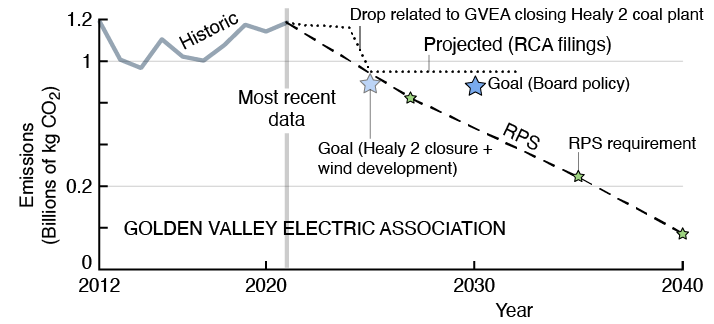
GVEA relies primarily on coal and oil power, giving it much higher emissions per KWh than other Railbelt utilities. It also has the lowest percentage of renewable power today. GVEA has a goal to reduce emissions 26% from 2012 levels. It also has a Strategic Generation plan which calls for the retirement of Healy 2 by 2025, and an attempt to acquire 40MW of wind power and 40MW of gas power from southern utilities. If this plan is implemented, it will meet GVEA’s emissions goal. This goal falls short of the emissions reductions which would be achieved under the 2027 RPS target, and does not come close to later RPS targets.
Homer Electric Association (HEA)
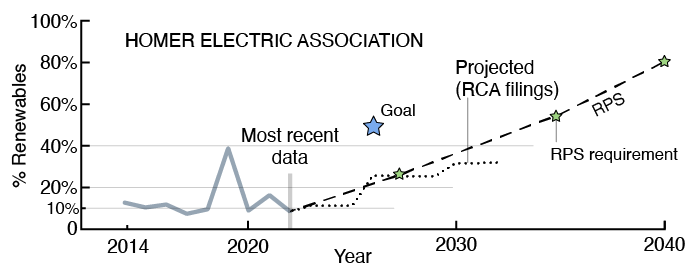
HEA has a goal to get 50% of its power from renewable energy by the end of 2025. Historically, HEA’s renewable energy has been around 10 to 15% of total energy. HEA’s RCA filings of gas needs project a variety of new renewable energy projects coming online, which meet the 2027 RPS target, but are far short of its 50% goal.
Matanuska Electric Association (MEA)
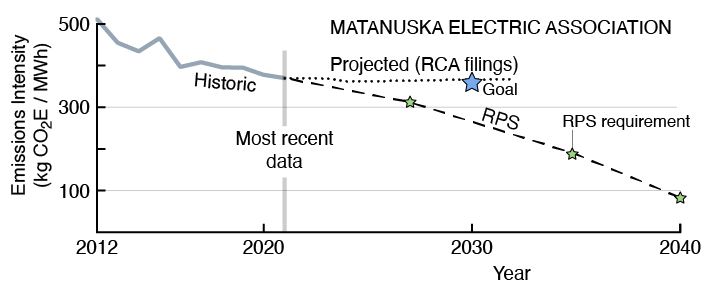
MEA has a goal to reduce emissions intensity 28% from 2012 levels by 2030. It reached 27% in 2021, and has stated in 2023 that the 28% goal has already been achieved. Most of the reduction was accomplished by the construction of its Eklutna gas plant in 2015. Since MEA anticipates a small increase in load, a small increase in either renewable energy or efficiency will be required to continue to meet the goal in later years. MEA’s RCA filings do not project any such change, and therefore do not quite align with the goal. MEA has signed a contract with a solar independent producer for a solar farm that will provide around 1% of its energy needs. MEA’s goals and projections fall short of the RPS standards and the emissions reductions that would be achieved by those standards at all target dates.
Methods
Data used is all publicly available information from utility board resolutions, state reports, or documents filed with the Regulatory Commission of Alaska, FERC, the EPA or the Energy Information Administration.
Future renewable energy from existing renewable sources was estimated by averaging 2020 and 2021 production, as stated in each utility’s annual report to the RCA. This number varies substantially year to year, as weather affects hydropower availability. Power plant level production was used for utility-owned plants, while purchased power amounts were used for other plants.
Total power needs and gas use projections for each utility were taken from the most recent RCA filings in docket I-15-001, from early 2023. Gas contract amounts were also taken from these filings. Power needs beyond 2032 were assumed to be flat at 2032 levels.
Emissions data for each power plant come from annual EPA filings.
Future gas plant efficiency was assumed to be flat at 2021 levels. 2021 numbers for emissions per MWh and gas use per MWh were calculated for all central area gas plants as one pool, and for HEA plants as a separate pool. For gas-burning utilities, these numbers were used to convert between emissions, gas use, and renewable energy. This assumption means that all decreases in gas use or emissions are assumed to come from an increase in renewable energy. It also means that increased use of renewable energy is assumed not to change the efficiency of gas plants. In reality, this may change in both directions. It is possible that there are efficiency increases to be gained from changes in dispatching or transmission improvements, and also possible that running gas plants at lower levels will reduce their efficiency.
GVEA has a number of different electricity sources with different emissions profiles, making the conversion between emissions, gas, and renewable energy more difficult. In all scenarios GVEAs gas use in 2025 and beyond is assumed to be equal to the 4 Bcf projected for 2025 in its RCA filing. Similarly, Healy 2 is assumed to close by 2025 in all scenarios. For GVEA goals, RCA filings, and the 2027 RPS, all other coal generation is held constant, with additional gas or renewable power displacing diesel generation. Wind power to meet GVEA’s goal of 40MW is assumed to have a 35% capacity factor. For the 2035 RPS, Healy 1 is also assumed to be closed, with the only coal power coming from the Aurora CHP plant, and additional renewables displacing diesel. For the 2040 RPS, the total Railbelt fossil power mix is assumed to equal the 78% gas, 18% oil and 4% coal assumed in NREL’s RPS study, with GVEA responsible for all of the oil and coal generation.
References:
Renewable Portfolio Standard: SB101 and HB121
EPA emissions data
NREL RPS study
State Cook Inlet Gas Forecast
RCA search tool, for utility annual reports and other data
GVEA strategic generation plan, presentation of options, RCA filing
MEA carbon reduction options, and RCA filing
CEA carbon intensity, strategic generation plan, clean energy scenarios, and RCA filing
HEA board policies, and RCA filing
Created: April 26, 2023